Case Study
Neon Analytics Dashboard
User research, UI Design, Prototyping
Challenge
Neon is an automatic video thumbnail recommendation product that ingests online videos and finds the most compelling image frames to be use as the thumbnail. Neon also collects data to measure how well the recommended images are performing on customers’ sites. Customers using Neon during a trial period wanted insight into this data to understand how much (if any) value Neon thumbnails were generating.
Without a way to demonstrate that Neon-selected thumbnails were generating higher click-through rates during the trial, it was challenging for Neon (the company) to convert customers to a paid subscrition at the end of the trial.
Goal
Make it easy for customers to understand the value they were getting from Neon throughout the trial period.
Outcome
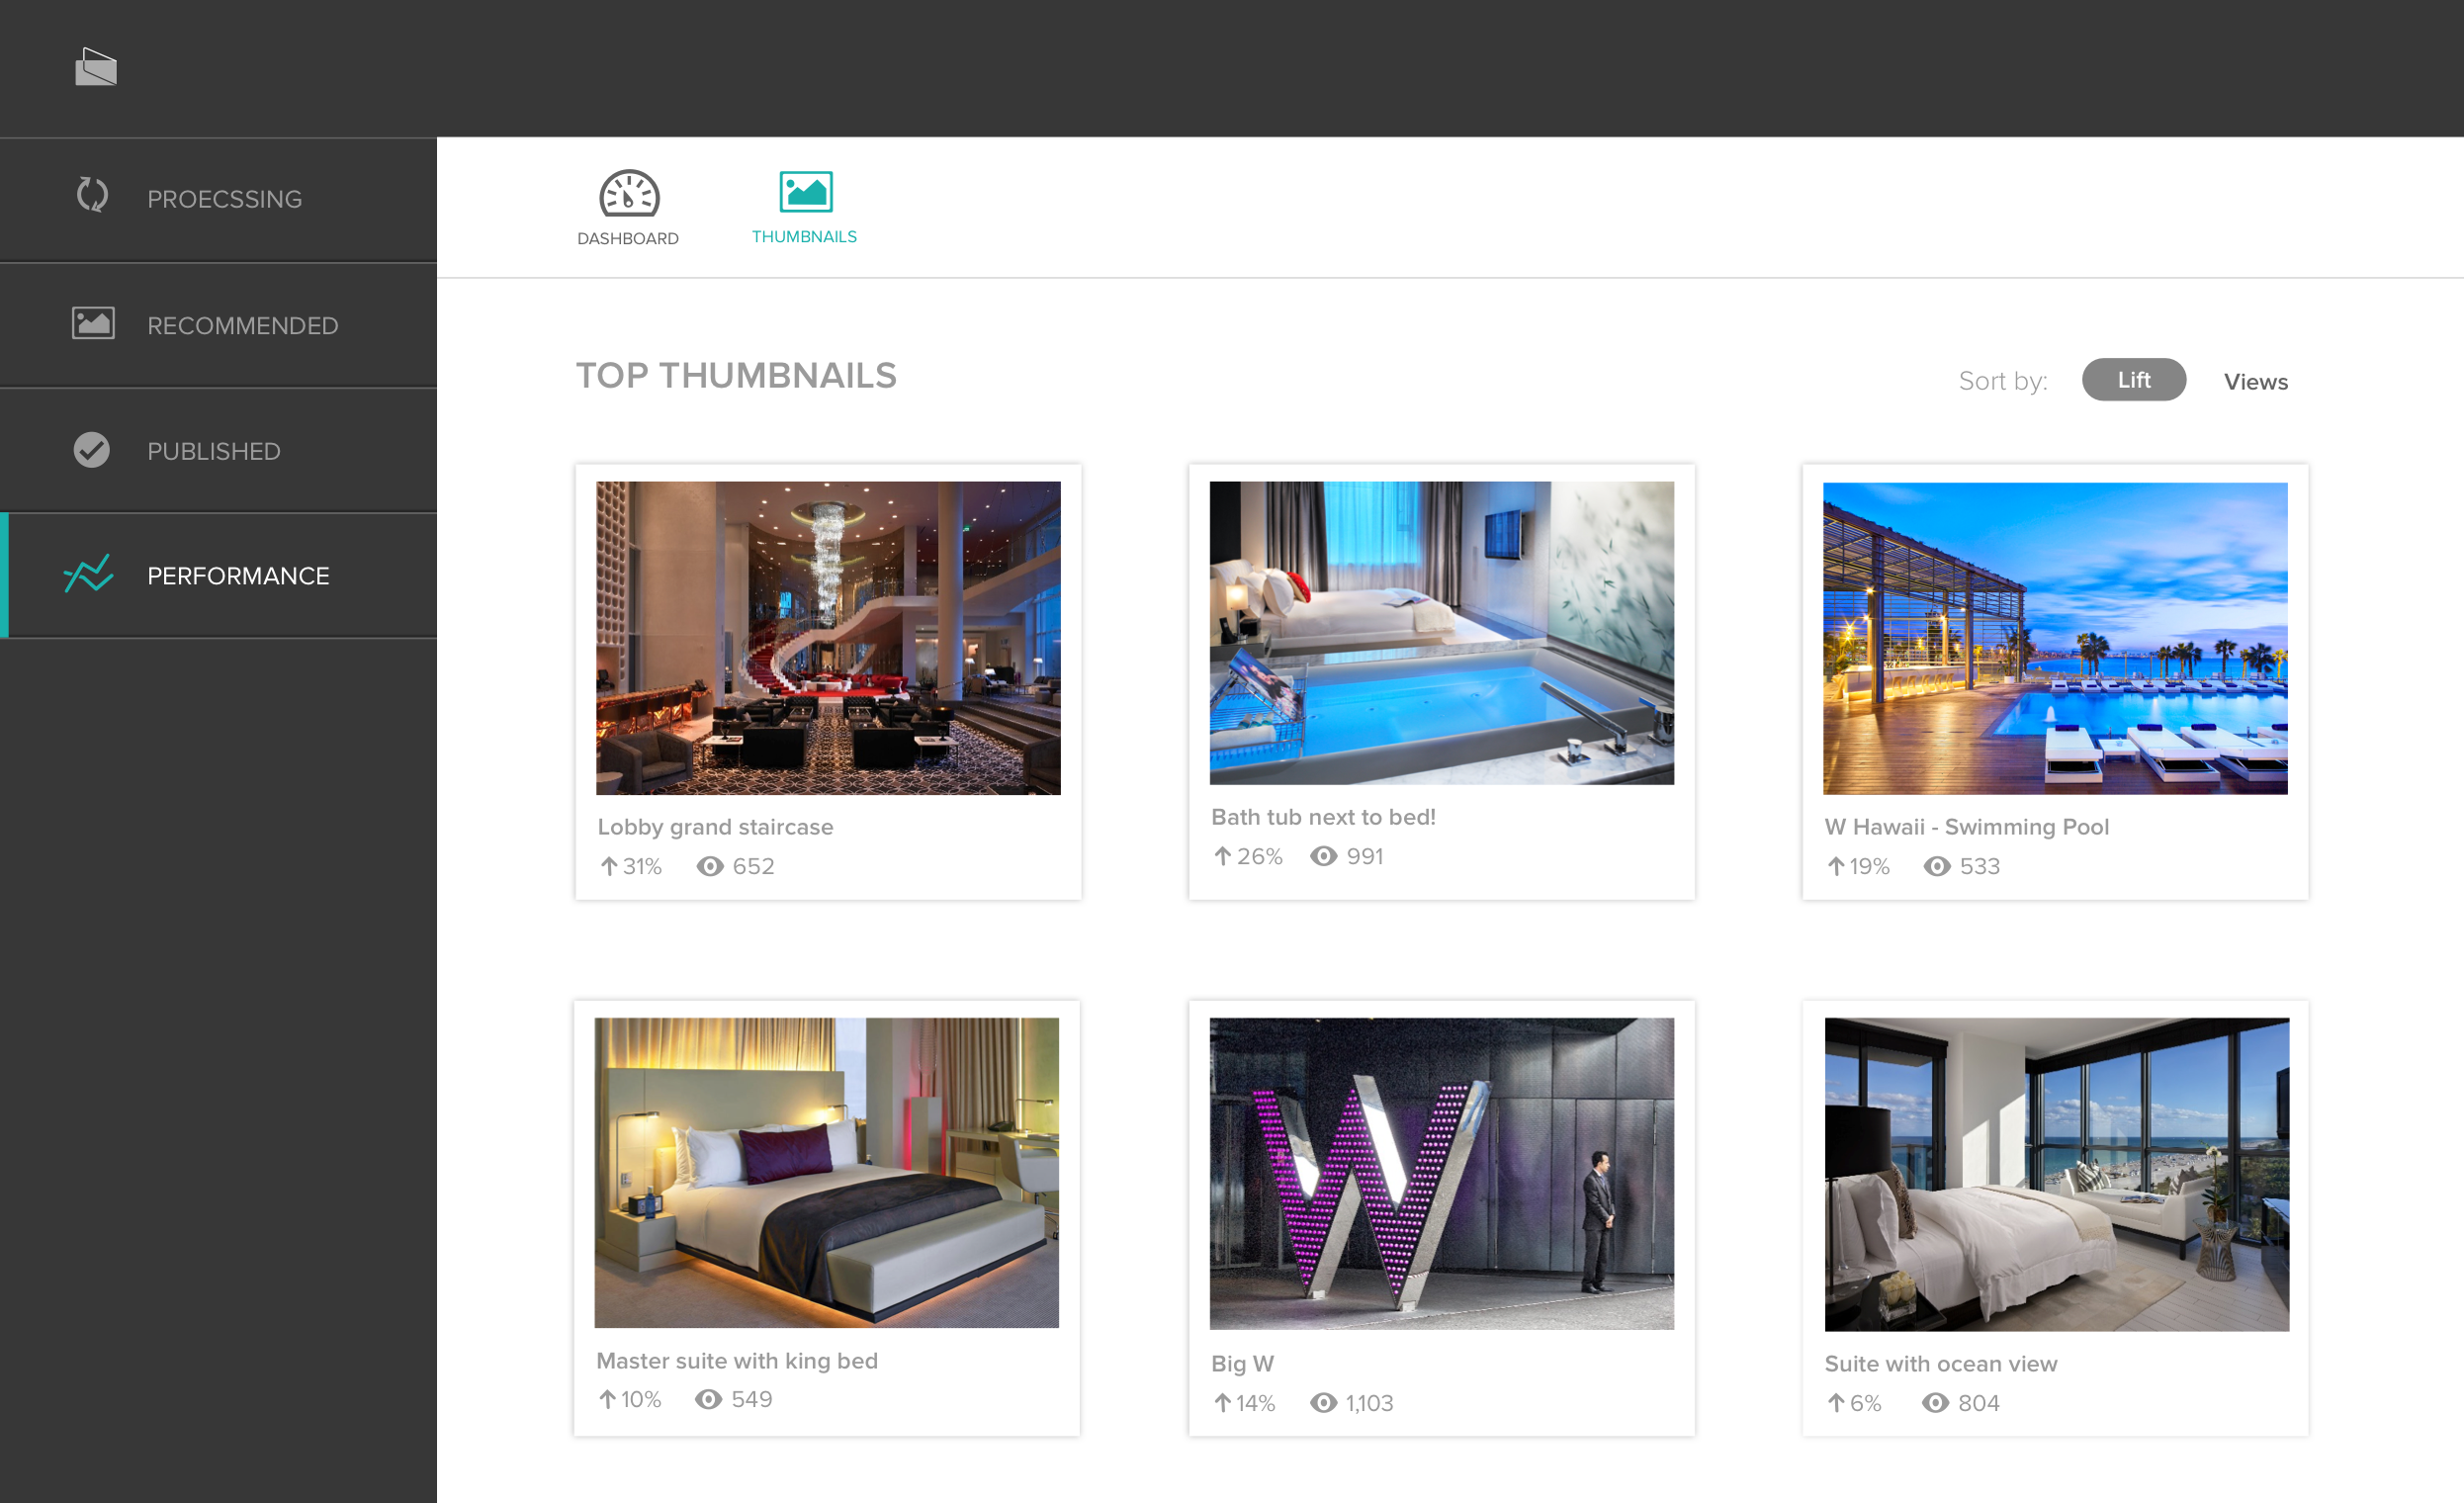
We built a dashboard that made it easy for customers to get a birds-eye view of how the product was performing, and the value it was providing. The dashboard displayed performance metrics including click-through rates for Neon thumbnail images compared to thumbnails selected by customers' video editors.
Process
Our first step was to conduct user interviews to better understand both the problem to be solved, and the people experiencing the problem. Some of the things we heard from were:
We need reinforcement that [Neon] is valuable.
Without data, [Neon] has no perceived value.
We also spent time exploring existing solutions to the problem -- how was it currently being solved, and what could be improved?

Prototype
After a great deal of brainstorming and sketching, we honed in on one version of the product and created a high-fidelity HTML/CSS prototype.
Results
After releasing a beta version of the analytics dashboard, we received the quote below from one of our customers.


